Concepts

Thank you for taking the time to help reimagine our bus network!

First, let’s look at our bus network today, and then two Concepts for how it might change. We need to know what you think of the Concepts so we can design the best possible plan. Both Concepts show the same total amount of service that DART provides today. Note, these are concepts, they are not proposals.

A key difference between DART’s Existing Network and each concept is the frequency of service (how often a bus is coming). The frequency of service is shown by the color of the lines on the map.

Red lines mean a bus is coming every 15 minutes most of the day.
Dark blue lines mean a bus is coming every 30 minutes.
Light blue lines mean a bus is coming every 60 minutes.
Brown lines mean a bus that only runs during a few hours in the morning and a few hours in the evening on weekdays.

Brown zones are microtransit zones. Here, you would use an app or call DART Customer Service to get a ride to another place within the zone. The response time could be up to an hour, and you may be asked to walk to a major street to board the bus.

Paratransit Service
DART currently provides Paratransit service to a larger area than what is required by federal law (within a ¾ mile radius of a fixed-route bus line). DART will evaluate whether to make changes to its Paratransit zone during the Draft Network phase.

Existing Transit Network

DART’s existing network only has one frequent route. Most routes come every 20-60 minutes, but other routes run only during peak morning and afternoon hours on weekdays.

Existing DART Transit Network

Click on the map to view it in your web browser.

How should we design our new network?

It depends on our goal. If our goal is to get lots of people to ride the bus (high ridership), we would run frequent service where there are lots of people and jobs close together. If our goal is to reach as many places as possible (high coverage), we would spread out our bus service.

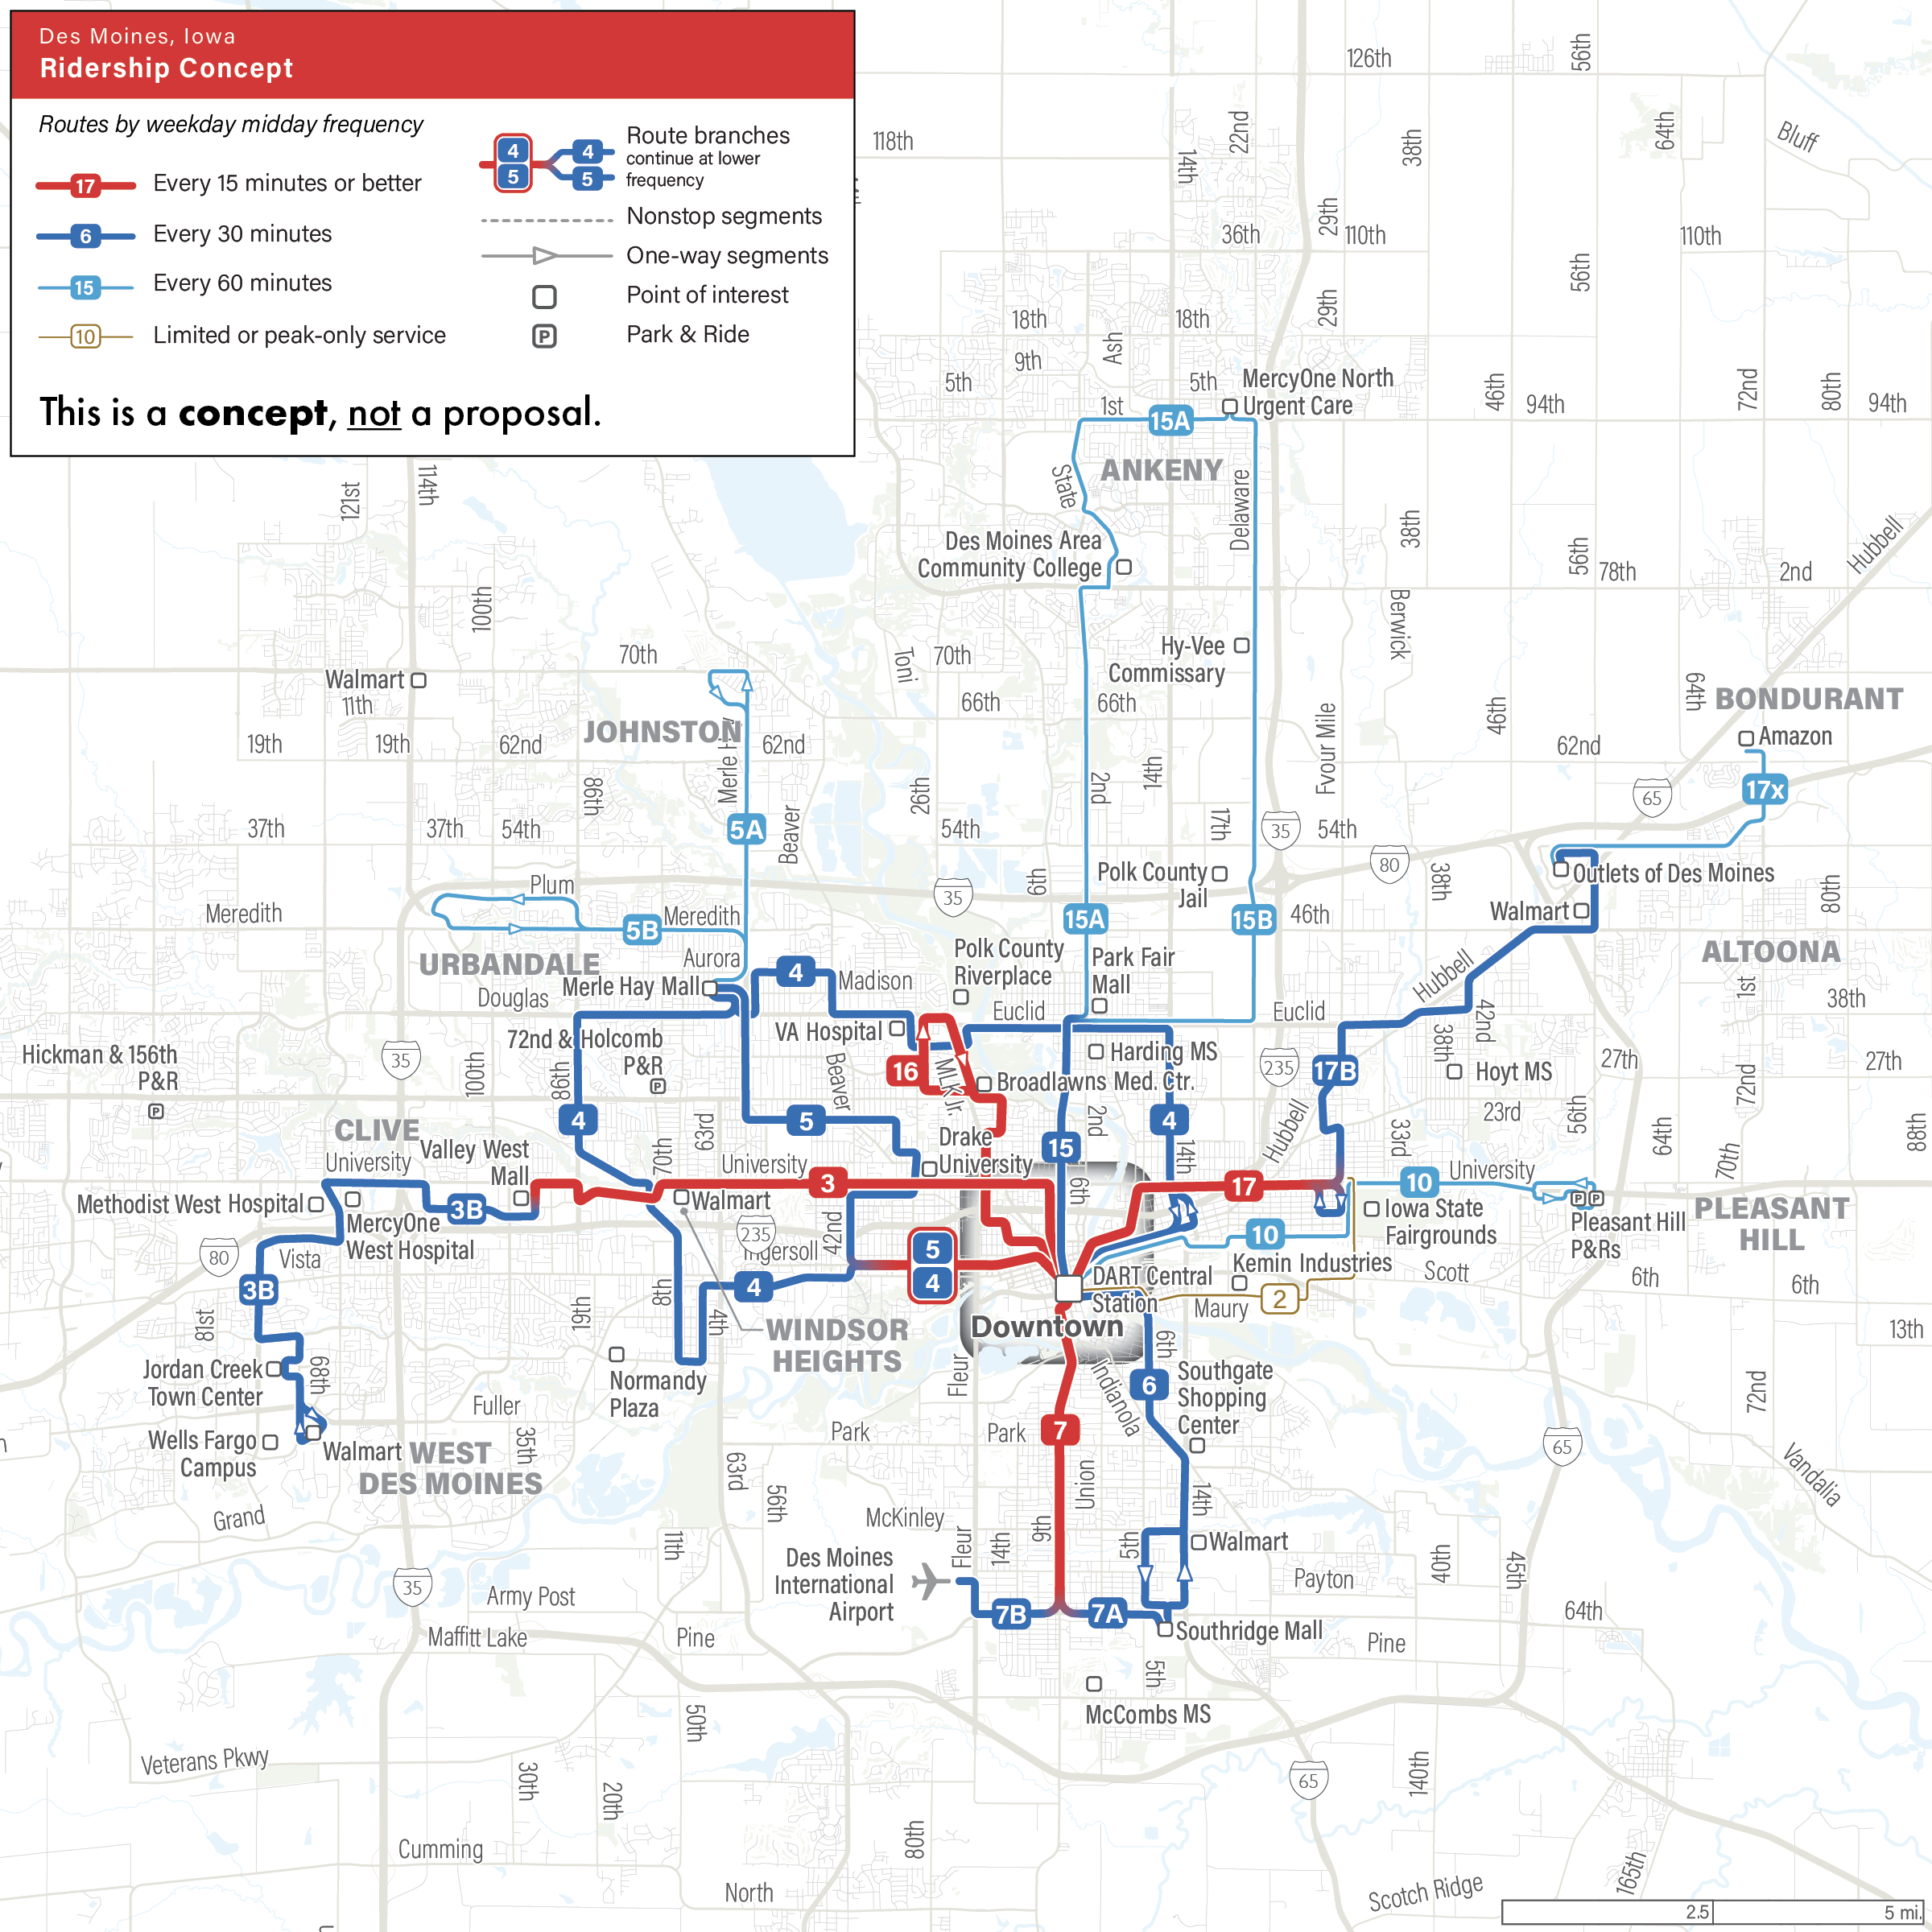
Ridership Concept

The Ridership Concept focuses on providing frequent service where most people and jobs are. Buses in these places would arrive every 15 minutes during most of the day, seven days a week. So many people would have to wait less time for a bus.

However, by providing so much bus service in these places, there would be fewer total bus routes, even with the same amount of money that DART has to deliver service today. Some riders would have longer walks to their bus routes, while others may not have bus service at all.

Where service remains, most buses would come more often than today, so more people would be able to get to more jobs and other locations faster. More people would find the service useful, so more people would ride the bus.

Ridership Concept Map

Click on the map to view it in your web browser.

Click here to view route schedules for the Ridership Concept.

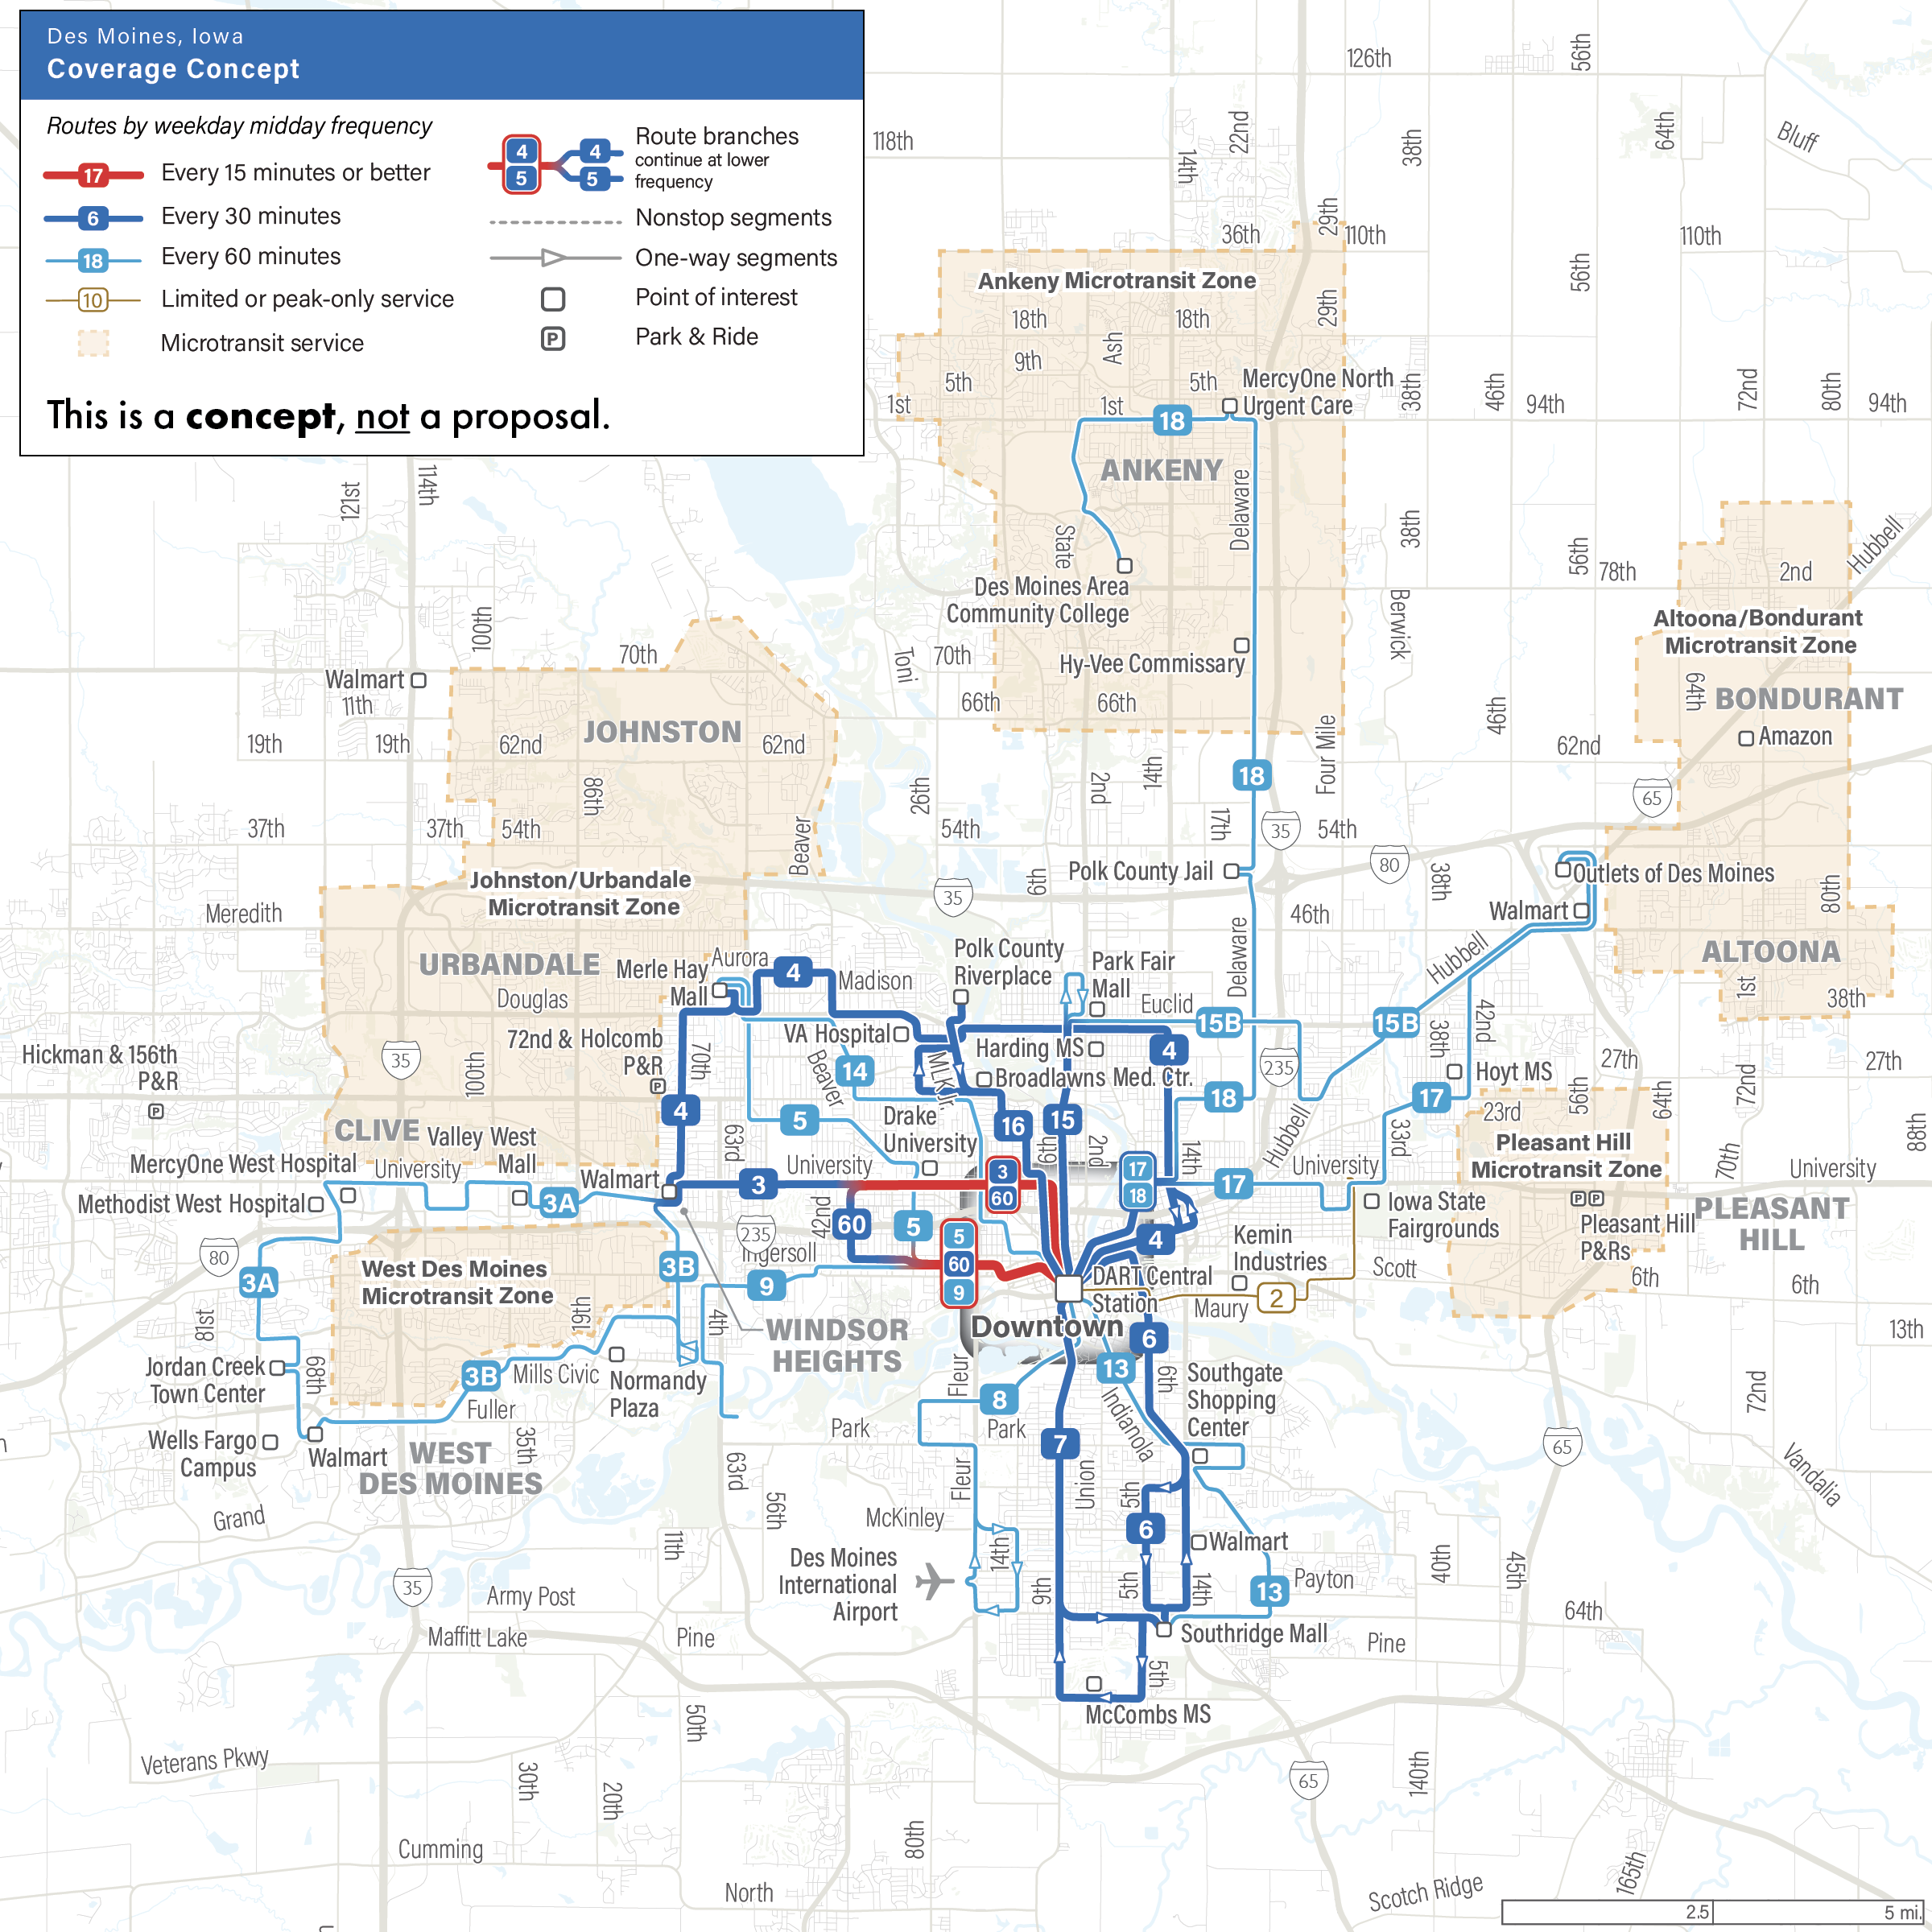
Coverage Concept

The Coverage Concept focuses on providing some service to as many people and places as possible. All places that have service today would still be near some service, and some areas would get new, though minimal, service.

Spreading the service out to so many areas means that most routes can’t offer service that comes often (every 15 minutes). There would be more total routes, but most buses would only come every 30 or 60 minutes. So most people would still have to wait a long time for a bus.

This concept has microtransit zones where you would use an app or call to get a ride to another point within the zone. The response time could be up to an hour, and you may be asked to walk to a major street.

Coverage Concept Map

Click on the map to view it in your web browser.

Click here to view route schedules for the Coverage Concept.
Comparing Outcomes

Ridership ConceptCoverage Concept
Ridership Concept Map
Click image to enlarge
Coverage Concept Map
Click image to enlarge
Higher Frequencies
Five routes would come every 15 minutes, all-week (including weekends). The number of residents near frequent service would increase from 4% to 13%. Jobs near frequent service would increase from 12% to 23%. Riders would have faster travel times across the region.
High Coverage
Since the service is spread out, the number of residents near any transit service would increase from 44% to 67%. The number of jobs near any service would increase from 50% to 71%.
Higher Access
In this Concept, the average resident would be able to reach 23% more jobs in 45 minutes, compared to DART’s Existing Network.
Shorter Walks
This Concept offers more total routes, so it would offer shorter walks to transit.
Coverage Loss
The total number of residents near any transit service would decrease from 44% to 38%. The number of jobs near any transit service would decrease from 50% to 46%.
Long Waits
Most routes would arrive every 30-60 minutes, so people would have to wait a long time for the bus and total travel times would be longer. In 45 minutes, the average resident would able to reach 9% less jobs, compared to DART’s Existing Network.